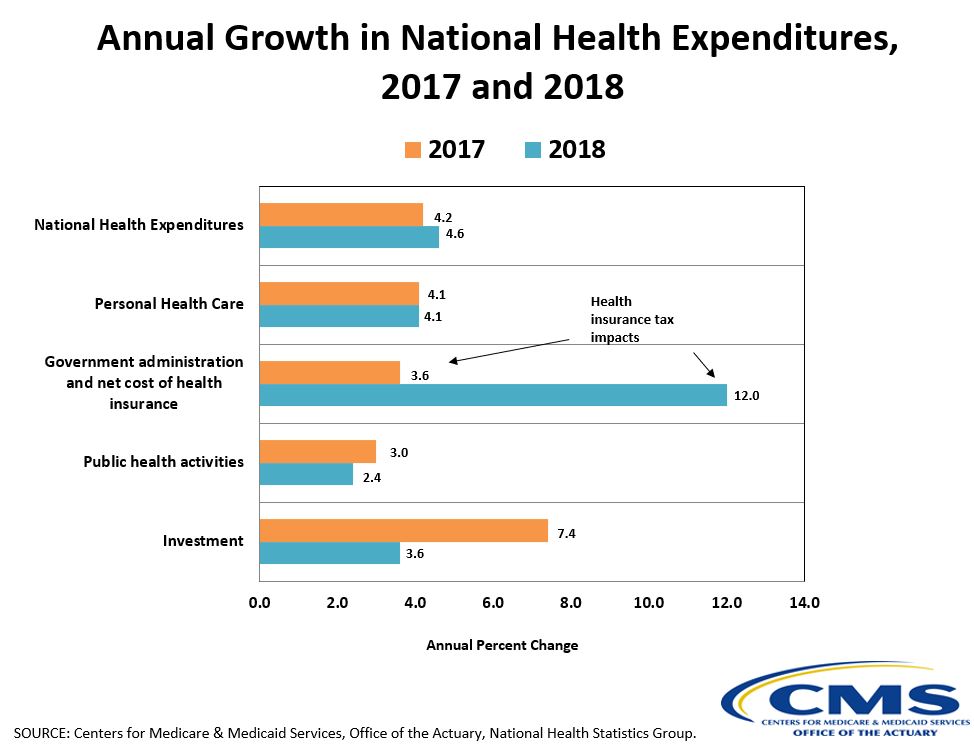
Healthcare spending in the U.S. rose 4.6% last year to $ 3.6 trillion, a growth rate higher than in 2017 but on par with 2016. It did not grow as fast as the nation’s gross domestic product, however, meaning the share of the economy devoted to healthcare shrank from 17.9% to 17.7%, according to data released Thursday.
The annual analysis from the CMS Office of the Actuary showed the growth increase was largely influenced by the reinstatement of the Affordable Care Act’s Health Insurance Tax, which was not in effect for 2017.
The impacts of the HIT showed up in the government administration and net cost of health insurance, which had an annual percentage change of 3.6% in 2017 but shot up to 12% last year.
The tax was imposed on all health insurers starting in 2014 and meant to raise money to help offset higher costs as more people gained coverage through the ACA’s Medicaid expansion and premiums subsidies. The Congressional Budget Office estimated it would raise more than $ 140 billion over 10 years.

Health Affairs
But payers hated the tax from the outset and have pushed lawmakers to do away with it. Congress implemented a one-year moratorium for 2017 and it was delayed for this year, but it was in place in 2018.
Payers have been lobbying heavily to get the tax put off again for 2020. America’s Health Insurance Plans pushes for full repeal of the tax, saying it “makes health care less affordable for the very people who need the most help affording health care.”
Another reprieve or repeal could be included in legislation to fund the government, which faces a shutdown Dec. 20 without action from Congress. Those talks are ongoing.
The data published Thursday comes as healthcare costs are poised to dominate national political conversation. Health policy has been a staple of debates among 2020 Democratic presidential contenders, some of whom back an expansive single-payer proposal while others stump for a more modest public option.
The analysts said the information showed no major surprises from 2018, but noted the potential changes on the horizon. Medicaid expansion in additional states this year and the zeroing out of the individual mandate penalty will affect the data released this time next year.

Health Affairs
The numbers reflect growth in Medicare Advantage plans, as fee-for-service shrank from 66% of the program’s spending to 64%. Private Medicare spending (which is mostly MA) was up 11.8% in 2018, compared to a 2017 growth rate of 9.9%. Enrollment in those plans was up in 2018 in a similar rate to the year before.
Private insurance spending was up 5.8% overall and a notable 6.7% for per enrollee expenditures. The increase was two percentage points above the 2017 increase and also eclipsed per enrollee spending rates for Medicare and Medicaid.
Growth in both hospital spending and physician and clinical services spending were down in 2018, in part because of changes in residual use and intensity of care. Prices were up for both, however, which CMS Administrator Seema Verma noted on Twitter.
She blamed provider consolidation and “the creation of monopolies” for the trend, saying the agency is “committed to policies that promote competition.”
Personal health care spending growth last year was flat at 4.1% but there were year-over-year fluctuations within that category. Retail prescription spending growth was up, along with dental services and home health. Personal spending on nondurable medical products grew at a rate of 3.6%, up from 2.2% in 2017. Durable medical equipment growth was up from 2.9% to 4.7% in 2018.
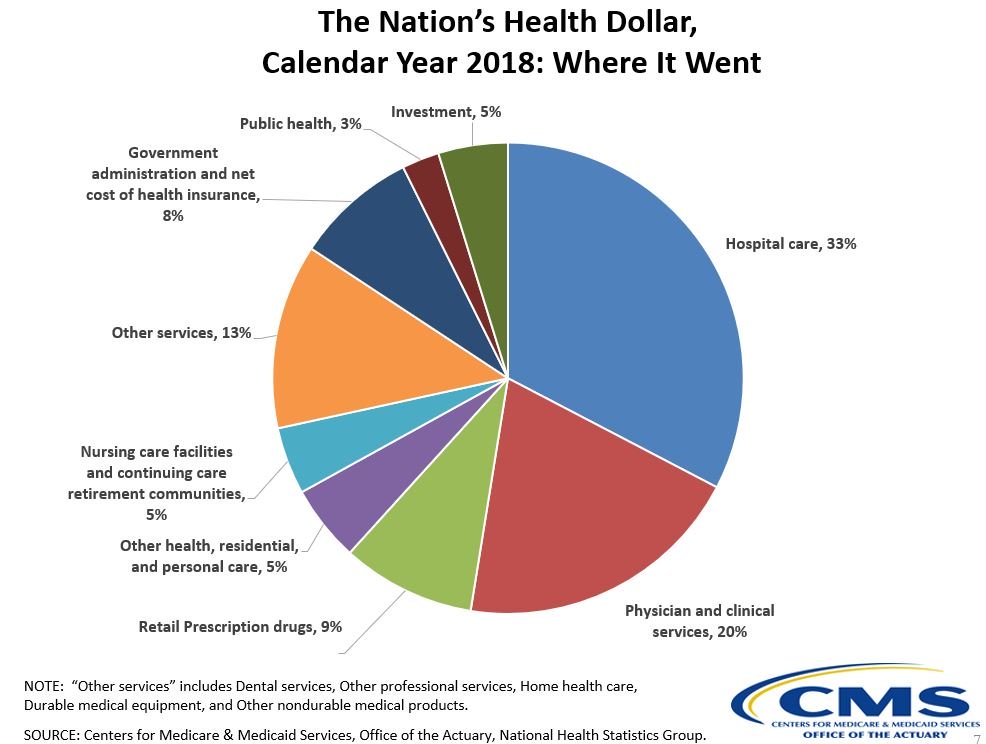
As for who was spending on healthcare, households and the federal government each accounted for 28%, followed by private businesses at 20% and state and local governments at 17%. Household spending includes out-of-pocket and premium costs.
